

Dashboards & Analytics
Stop Guessing How the Business Is Doing
Dashboards show real activity from your CRM, pipelines, tasks, and workflows so you can see movement, workload, and results in one place.
When the Business Feels Busy but You Can’t See the Progress

Most business owners don’t struggle because they lack information. They struggle because the information is all over the place.
You might feel like the team is working hard.
Leads are coming in.
Conversations are happening.
Tasks are getting assigned.
But when you stop and ask a simple question, things get fuzzy.
Are leads actually being followed up with?
Are deals moving forward or sitting in the same stage?
Are tasks being completed on time?
Are we actually growing, or just staying busy?
When those answers aren’t clear, you end up managing by instinct instead of facts. And instinct works… until the business grows beyond what you can track in your head.

Where This Shows Up in Your Business
Most businesses try to understand performance by piecing together information from multiple places.
You might check:
your CRM for new leads
your pipeline to see open opportunities
task lists to see what the team is doing
messaging tools to check communication activity
spreadsheets to track revenue or reporting
Each tool shows a small piece of the picture. But none of them show the full state of the business in one place. So leadership meetings turn into status updates instead of real decisions.
The Real Operational Problem
When visibility is fragmented, small issues stay hidden until they become bigger problems.
A pipeline stage fills up with stalled deals.
Follow-up slows down.
Tasks quietly pile up.
A marketing campaign stops generating engagement.
But without a clear view, these patterns are hard to spot early. Instead of seeing movement and trends, you react when something finally breaks.
Dashboards solve that problem by turning activity into visible patterns.

Each of those actions updates the dashboard automatically. Instead of manually compiling reports, the system reflects the current state of the business.
What Dashboards & Analytics Are
Dashboards inside Kyrios provide a live visual overview of what is happening across the system. They pull real data from activity that is already happening inside the platform.
For example:
A new lead is created.
A deal moves to a new stage.
A task is completed.
An email is opened.
An appointment is booked.
An invoice is paid.
Real-World Examples
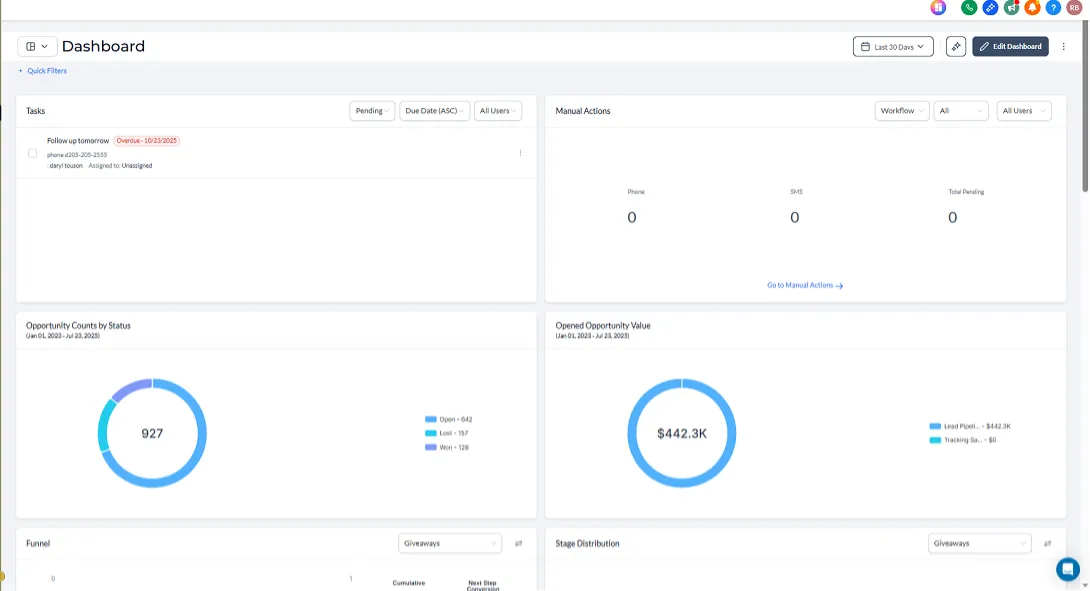
Pipeline
Visibility
A pipeline dashboard shows how many opportunities are sitting in each stage.
You can immediately see:
where deals are progressing
where they are stalling
where follow-up attention is needed
Team
Workload
Clients upload assets, review drafts, and approve revisions. Feedback and files stay organized in one place.
open tasks
overdue items
uneven workloads
completion patterns
This helps leaders identify bottlenecks before they affect customers.
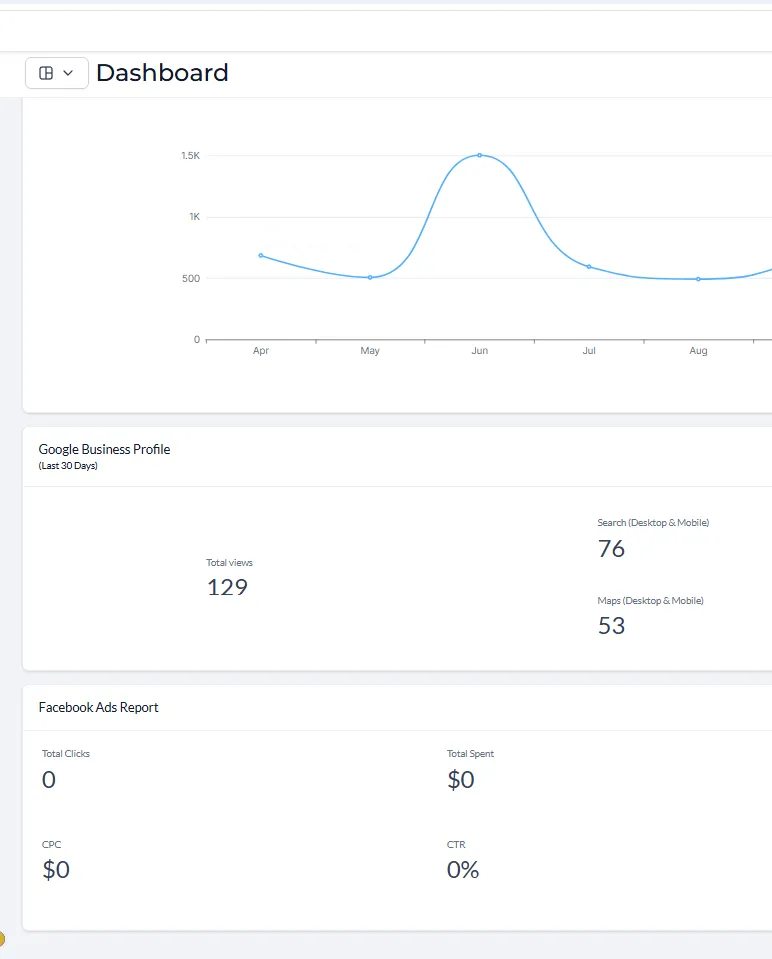
Campaign
Performance
Marketing dashboards reveal which campaigns are generating engagement.
You can quickly see:
new lead volume
response rates
appointment bookings
campaign engagement
Instead of guessing which marketing efforts are working, the activity is visible.
Revenue
Movement
Revenue dashboards track opportunities and closed deals.
You can see:
current pipeline value
deals won or lost
revenue closed this month or quarter
This allows leadership to track progress without building manual reports.
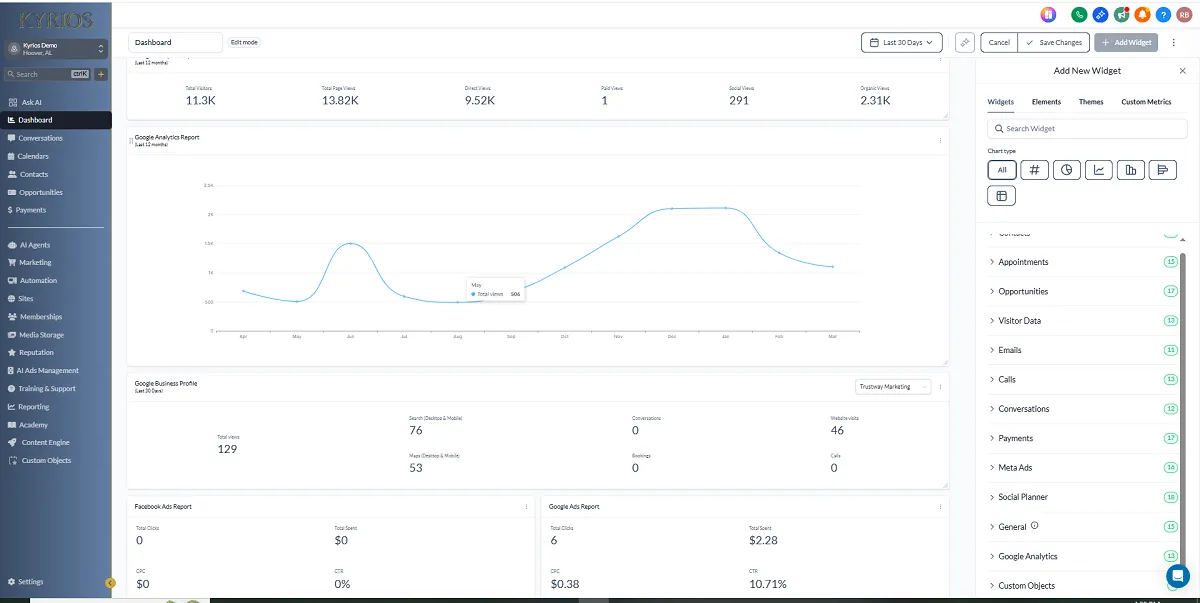
How Dashboards Work Inside Kyrios
Dashboards pull data directly from system activity across the platform. Because Kyrios connects CRM, pipelines, tasks, communication, and workflows, dashboards reflect real operational movement.
You can view data such as:
pipeline value by stage
opportunity win and loss rates
task completion activity
lead source performance
appointment booking volume
revenue and invoice status
Dashboards can also be filtered by:
date range
user
pipeline
tag
campaign
custom fields
Permissions control who sees which information, allowing team members to view relevant data while leadership sees the full picture.
Everything updates automatically based on system activity.
How Dashboards Connect to the Rest of Kyrios
Dashboards work because every other part of Kyrios feeds data into the system.
CRM activity shows who is entering the system.
Pipelines show where opportunities and processes stand.
Tasks show what work is being completed.
Workflows show what actions are triggered automatically.
Dashboards bring those signals together into one place so leadership can see how the business is actually operating.
What Changes Once You Have Clear Visibility
When you can see the system clearly, the way you manage changes.
You stop asking for constant updates. You stop manually counting numbers. You stop guessing whether progress is happening.
Instead, you open the dashboard and see:
Movement
Stagnation
Workload
Growth
That clarity allows leaders to focus on decisions instead of investigation. And when problems appear, you catch them early instead of reacting later.
Dashboards Inside Kyrios
Kyrios was designed to reduce the pressure of running a growing business. Dashboards play a key role in that shift.
They turn scattered activity into a clear operational picture so leaders can understand what is happening without digging through multiple tools.
Instead of guessing how things are going, the system shows you.
Replace Guesswork With Clarity
The goal of dashboards isn’t to create more charts. The goal is to help you understand the real state of your business at a glance.
When activity across CRM, pipelines, tasks, and workflows becomes visible, leadership becomes simpler.
1236 Blue Ridge Blvd, Hoover, AL 35226
Download the Kyrios app now


Copyright Kyrios Systems 2026 - All Rights Reserved
(205) 736-8422
1236 Blue Ridge Blvd,
Hoover, AL 35226

Company